Iván Cuevas Salazar
Supervision: Lailong Song and Dr.-Ing. Johannes Fender
Iván Cuevas Salazar did his honours project at Fachgebiet Computational Mechanics and BMW Group
Project Description
A spring-mass model was created in order to produce a first assessment of the vehicle crash performance (acceleration and deformation profile) in the side impact scenario (Fig. 1). Since the exact geometry of the vehicle structure is not known in the early design phase, a simplified arrangement of springs is used to represent the structure’s stiffness of the barrier and the vehicle. The springs’ force-displacement curves are modeled as piece-wise linear. From the solution of the system of differential equations derived from the spring arrangement, the kinematic performance of the vehicle as well as the intrusion profiles of the structure are obtained.
For the “forwards calculation”, the inputs are the masses, the initial velocities, the geometrical parameters of vehicle, and the force-displacement characteristics of springs. The outputs are the deformation profile (nodal positions), accelerations, velocities and rotation of vehicle. The relation between acceleration, rotation and force-displacement curves will be obtained in order to perform the “backwards calculation” to be used in the so called side impact corridors or upper and lower limits for the force-displacement curves that satisfy the constrains of maximum deformation and acceleration in crashworthiness design.
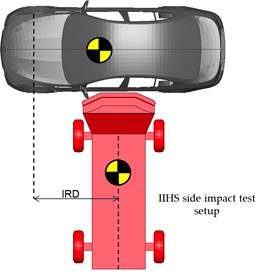
Figure 1. IIHS Side Impact Test
Side impact: IIHS crash test protocol
Side impact crash tests consist of a stationary vehicle and a cart fitted with an Insurance Institute for Highway Safety (IIHS) deformable barrier that crashes the driver’s side at 50km/h. The 1,500 kg moving deformable barrier (MDB) strikes the vehicle a 90 degree angle as depicted in Figure 1. The impact reference distance (IRD) is defined as the rearward distance from the test vehicle front axle to the centerline of the deformable barrier when it first contacts the vehicle. This distance is calculated to avoid any overlap with the front or rear axles of the vehicle and to maximize the loading on the occupant compartment [1]. Additionally the test also measures the loads on two small side impact dummy or SID twos. One of the evaluation parameters of this test is the overall kinematic behavior of the vehicle. Accelerometers are placed on the opposite side of the car so that the lateral accelerations can be measured. The force and deformation sensors of the crash test dummies are checked as well as the impact location of the head and shoulder.
The simplified crash model focuses on the deformation of the occupant compartment. Therefore, the most relevant parameters of the test are the B pillar intrusions. The interior and exterior surfaces of the B pillar are measured pre and post-crash and then the deformation profile is obtained as seen in Figure 2 [1].
![Figure 2. Example B pillar vertical profiles [1]](/wp-content/uploads/2020/04/IvanCuevasSalazar_2014_Figure-2.jpg)
Figure 2. Example B pillar vertical profiles [1]
Vehicle structures: beneath the skin
The two most important aspects of crashworthiness are: energy absorption and controlling the kinematics of the occupants. This last part is done by the restrains system, the seat belt and airbags. Synchronizing the restrains system and tuning the fire times of the airbags are details that are designed after the structure. They are also typically more difficult to simulate than the response of the structure. The side impact corridors and the simplified simulation are focused in the design of the occupant compartment structure.
A typical car structure is presented in Figure 3. All the components work together as a system and dissipate the energy throughout the vehicle. The most relevant components for the side impact are: B-Pillar (red), A-Pillar (green), C-Pillar (orange), Hinge-Pillar (brown), Rocker (blue), Rail (pink) and Cross-members (green).
![Figure 3. BIW Side Impact Car Structures [3]](/wp-content/uploads/2020/04/IvanCuevasSalazar_2014_Figure-3.jpg)
Figure 3. BIW Side Impact Car Structures [3]
The energy of the impact is distributed through load paths and from each load path a force-displacement curve may be extracted. The behavior of any structure can be characterized by applying a force and obtaining a displacement. Let the point “P” be a reference point where no deformation is observed and the point “R” is where the force is applied. The displacement “S” is just the relative displacement of these two points and a force-displacement curve can be generated from this relation. It is possible to perform this simplification for every load path in the vehicle structure.
In a finite element model, the response would be the result of the interaction of the stiffness of all the components. In the model, the stress-strain curves are provided for each material and as a response the deformations, intrusions and accelerations of the car are obtained. This is called the forwards calculation. The backwards calculation would consist on giving as an input the desired intrusions and accelerations and obtaining the correspondent stiffness’s needed for that particular behavior. By providing a force-deformation curve, the intrusion profile can be obtained. Therefore, it is useful to ensure that each component has the required stiffness in order to obtain the desired intrusion profile.
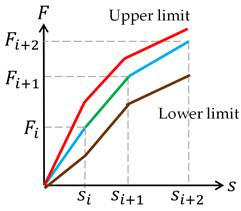
Figure 4. Force-displacement curve with corridors
During the engineering design of the components of the vehicle, it is almost impossible to design a component to have a precise force-displacement curve, mostly due to conflicting objectives such as weight, cost, or cross platform use of the component as well as other design restrictions. One strategy to deal with this issue is to provide an upper maximum value and lower minimum value, a corridor, and ensure that the response of the component is within these limits, as presented in Figure 4. If the limits are chosen correctly, the desired intrusion profile and other kinematic responses from the vehicle could still be obtained. To obtain such corridor, several iterations and adjustments to the design are performed. Consequently, a fast and efficient tool is required and while the FE models provide a sufficient level of detail, the average calculation time is restrictive. Hence, a simplified tool was developed and the results are now presented.
A simplified approach: Lumped-Mass Tool
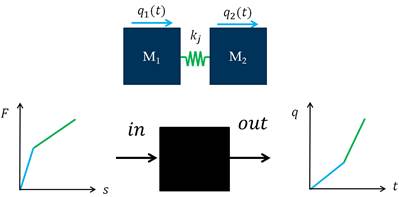
Figure 5. Simplified Lumped-Mass system
In order to simplify and analyze the vehicle’s structure, its components can be classified according to the amount of energy absorbed during the crash and the subsequent amount of deformation. The deformable components are represented by spring elements while the components that do not observe a significant amount of deformation are considered as mass blocks located at the nodes of the spring elements. The inertia and acceleration of the mass components combined with the response of the spring elements has proven to be sufficient for first assessments on the crashworthiness and design of a new vehicle. This method is chosen due to the simplicity and the capability to produce fast calculations compared to more complex solutions such as direct applications of the finite element method. The kinematic equations are obtained by generating the energy equations from the two-mass system described in Figure 5. The final displacement equation is as follows:

Equation 1. General displacement equation
A one dimensional approach was used to make the first validation of the simplified model. The model was compared against data obtained from finite element simulations of the Federal Motor Vehicle Safety Standard (FMVSS) 301 rear crash test, where a moving deformable barrier impacts the vehicle at 80 km/h [4]. The comparison is presented in Figure 6. As seen in the top left corner, the force-displacement curve has been adapted to use only 3 segments. In the other sub plots of the figure, a comparison of the velocities and the so-called SPUL value ( ) is displayed. The range of validity of the simplified model finds its limit at the point of spring back and maximum deformation, in the figure presented, this point is reached at 60ms. The difference of the results from the finite element and the Lumped-Mass tool is minimum before the point of maximum intrusion is reached. This comparison was performed on 13 different vehicle variants obtaining satisfactory results.
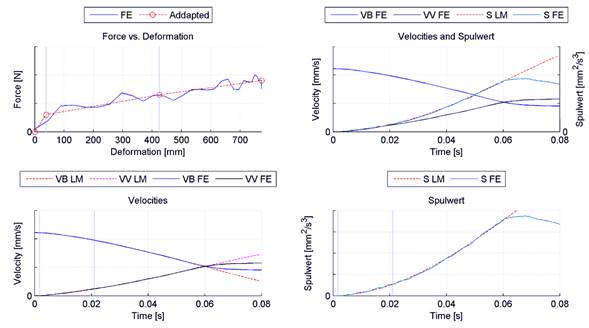
Figure 6. Comparison with FE models of the FMVSS 301
2D Model: Rotations
To be able to represent the rotation of the vehicle and several points of intrusion in the structure, a more complex model was created. As presented in Figure 7, besides the 1D displacements of each mass, the vertical displacement of the second mass as well as the rotation are now introduced as degrees of freedom. Afterwards, more elements are introduced in order to represent the intrusion profiles. Additionally, effects such as the variable lever arm and the deformation front rotation are introduced.
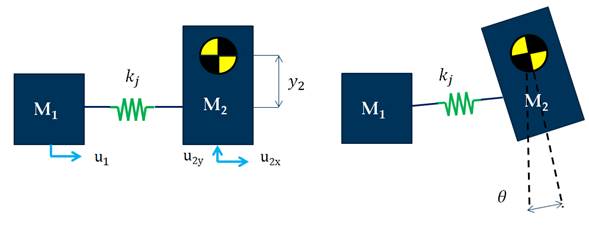
Figure 7. Rotation modelling
Conclusions
![Figure 8. Side impact test using the Lumped-Mass tool [2]](/wp-content/uploads/2020/04/IvanCuevasSalazar_2014_Figure-8.jpg)
Figure 8. Side impact test using the Lumped-Mass tool [2]
A simulation of the IIHS side impact test described earlier was performed using the Lumped-Mass tool. The model consisted of 18 spring elements. The final deformation state is presented in Figure 8. The spring elements are modeled as piecewise linear and the stiffness in the longitudinal as well as along the vertical axis of the vehicle varies representing a typical setup of the B pillar and other structures in the occupant compartment. As a concluding remark, it can be stated that the simplified approach of the Lumped-Mass tool is able to predict the overall behavior of the vehicle in one dimension and could potentially predict it in a two or three dimensional space. The method is suitable for early phases of the structural design and combined with the corridor concept, it could reduce the development and design times of the vehicle’s components.
References
[1] Insurance Institute for Highway Safety. Side Impact Crashworthiness Evaluation Crash Test Protocol. IIHS, Arlington VA, 2014
[2] BMW AG. Technische Daten BMW M5 Limousine. http://www.bmw.de/de/neufahrzeuge/M/m5-limousine/2013/technische-daten.html
[3] NCAC. 2012 Toyota Camry, Detailed Model. The National Crash Analysis Center of The George Washington University, 2012
[4] NHTSA. Evaluation of FMVSS No. 301 Fuel System Integrity. U.S. Department of Transportation. Washington, DC, 2014